So which live wildfire smoke map for NYC today shows conditions street by street? Strictly speaking, none of them. You'll get closest with the AirNow Fire and Smoke Map, sensor layer switched on, checked against NYC Health's street-level monitors. Every wildfire smoke event since 2023 has taught New Yorkers that knowing what each map can and can't see matters more than which app you open.
And once smoke reaches your block, its next stop is your ductwork, which is exactly where most smoke maps go quiet.
TL;DR Quick Answers
live wildfire smoke map NYC today
The closest thing to a live, street-level wildfire smoke map for NYC today is the AirNow Fire and Smoke Map with its corrected sensor layer on, checked against NYC Health’s street-level PM2.5 monitors. Any map only shows outdoor air, though. Your ducts and filter decide how much reaches your family.
Closest to street level: Corrected PurpleAir sensors, shown as squares on the AirNow Fire and Smoke Map, plus NYC Health’s real-time monitors along the BQE, FDR Drive, and Van Wyck Expressway.
Best for health decisions: AirNow’s NowCast AQI, backed by NYS DEC Air Quality Health Advisories whenever DEC expects levels to top 100.
Best for seeing where the smoke comes from: A live borough smoke map that layers fire perimeters, NOAA satellite plumes, and AQI color in one view.
Before you trust a number: Raw PurpleAir readings run about 40 percent high, so switch to the corrected “US EPA” view first.
What to do indoors at AQI 101 and up: Close the windows, set any fresh-air intake to recirculate, switch the HVAC fan to On with a MERV 13 filter, and change the filter once the smoke clears.
Top Takeaways
No map shows smoke street by street, though corrected sensors and NYC Health's street-level monitors come closest.
Make health calls with AirNow and time your day with the nearest corrected sensor.
Raw PurpleAir numbers run about 40 percent high until someone corrects them.
Rooftop and street readings split furthest near highways and busy roads.
Smoke slips in through leaky returns and fresh-air intakes, so seal up, run the fan, and use MERV 13.
Change your filter after every smoke event, and call for a duct inspection only if soot or odor lingers.
What "Street-Level" Actually Means on a Smoke Map
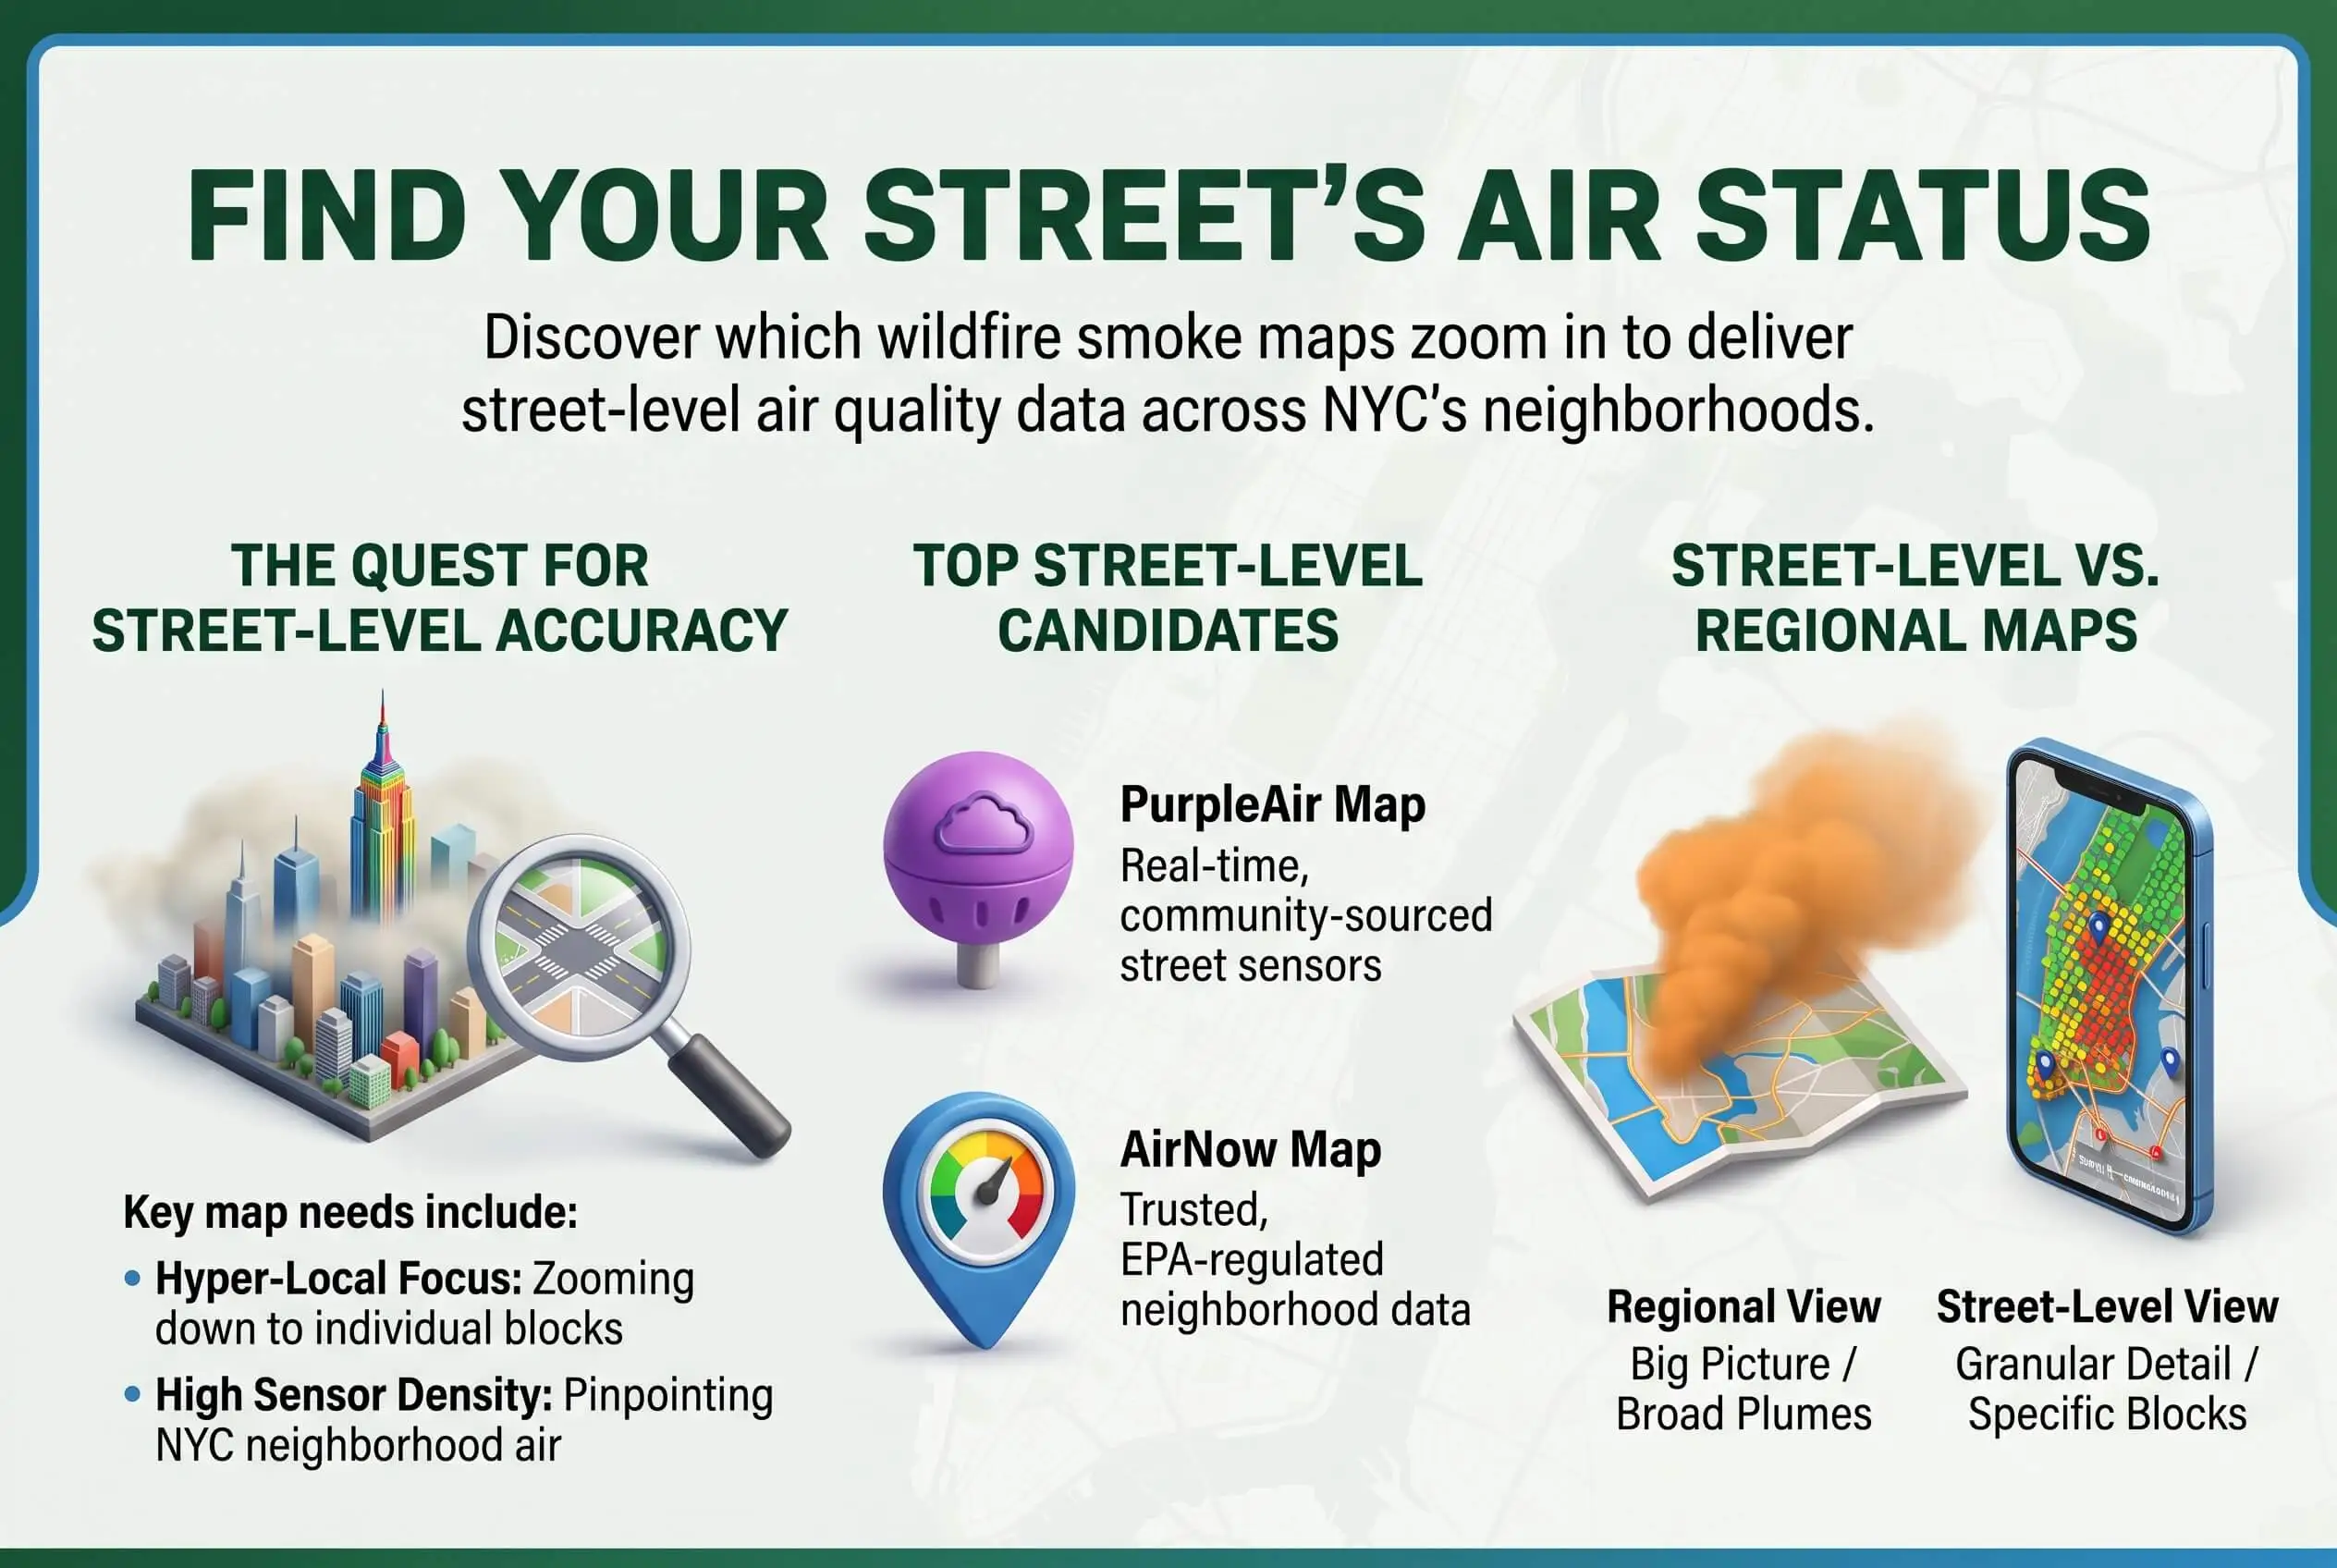
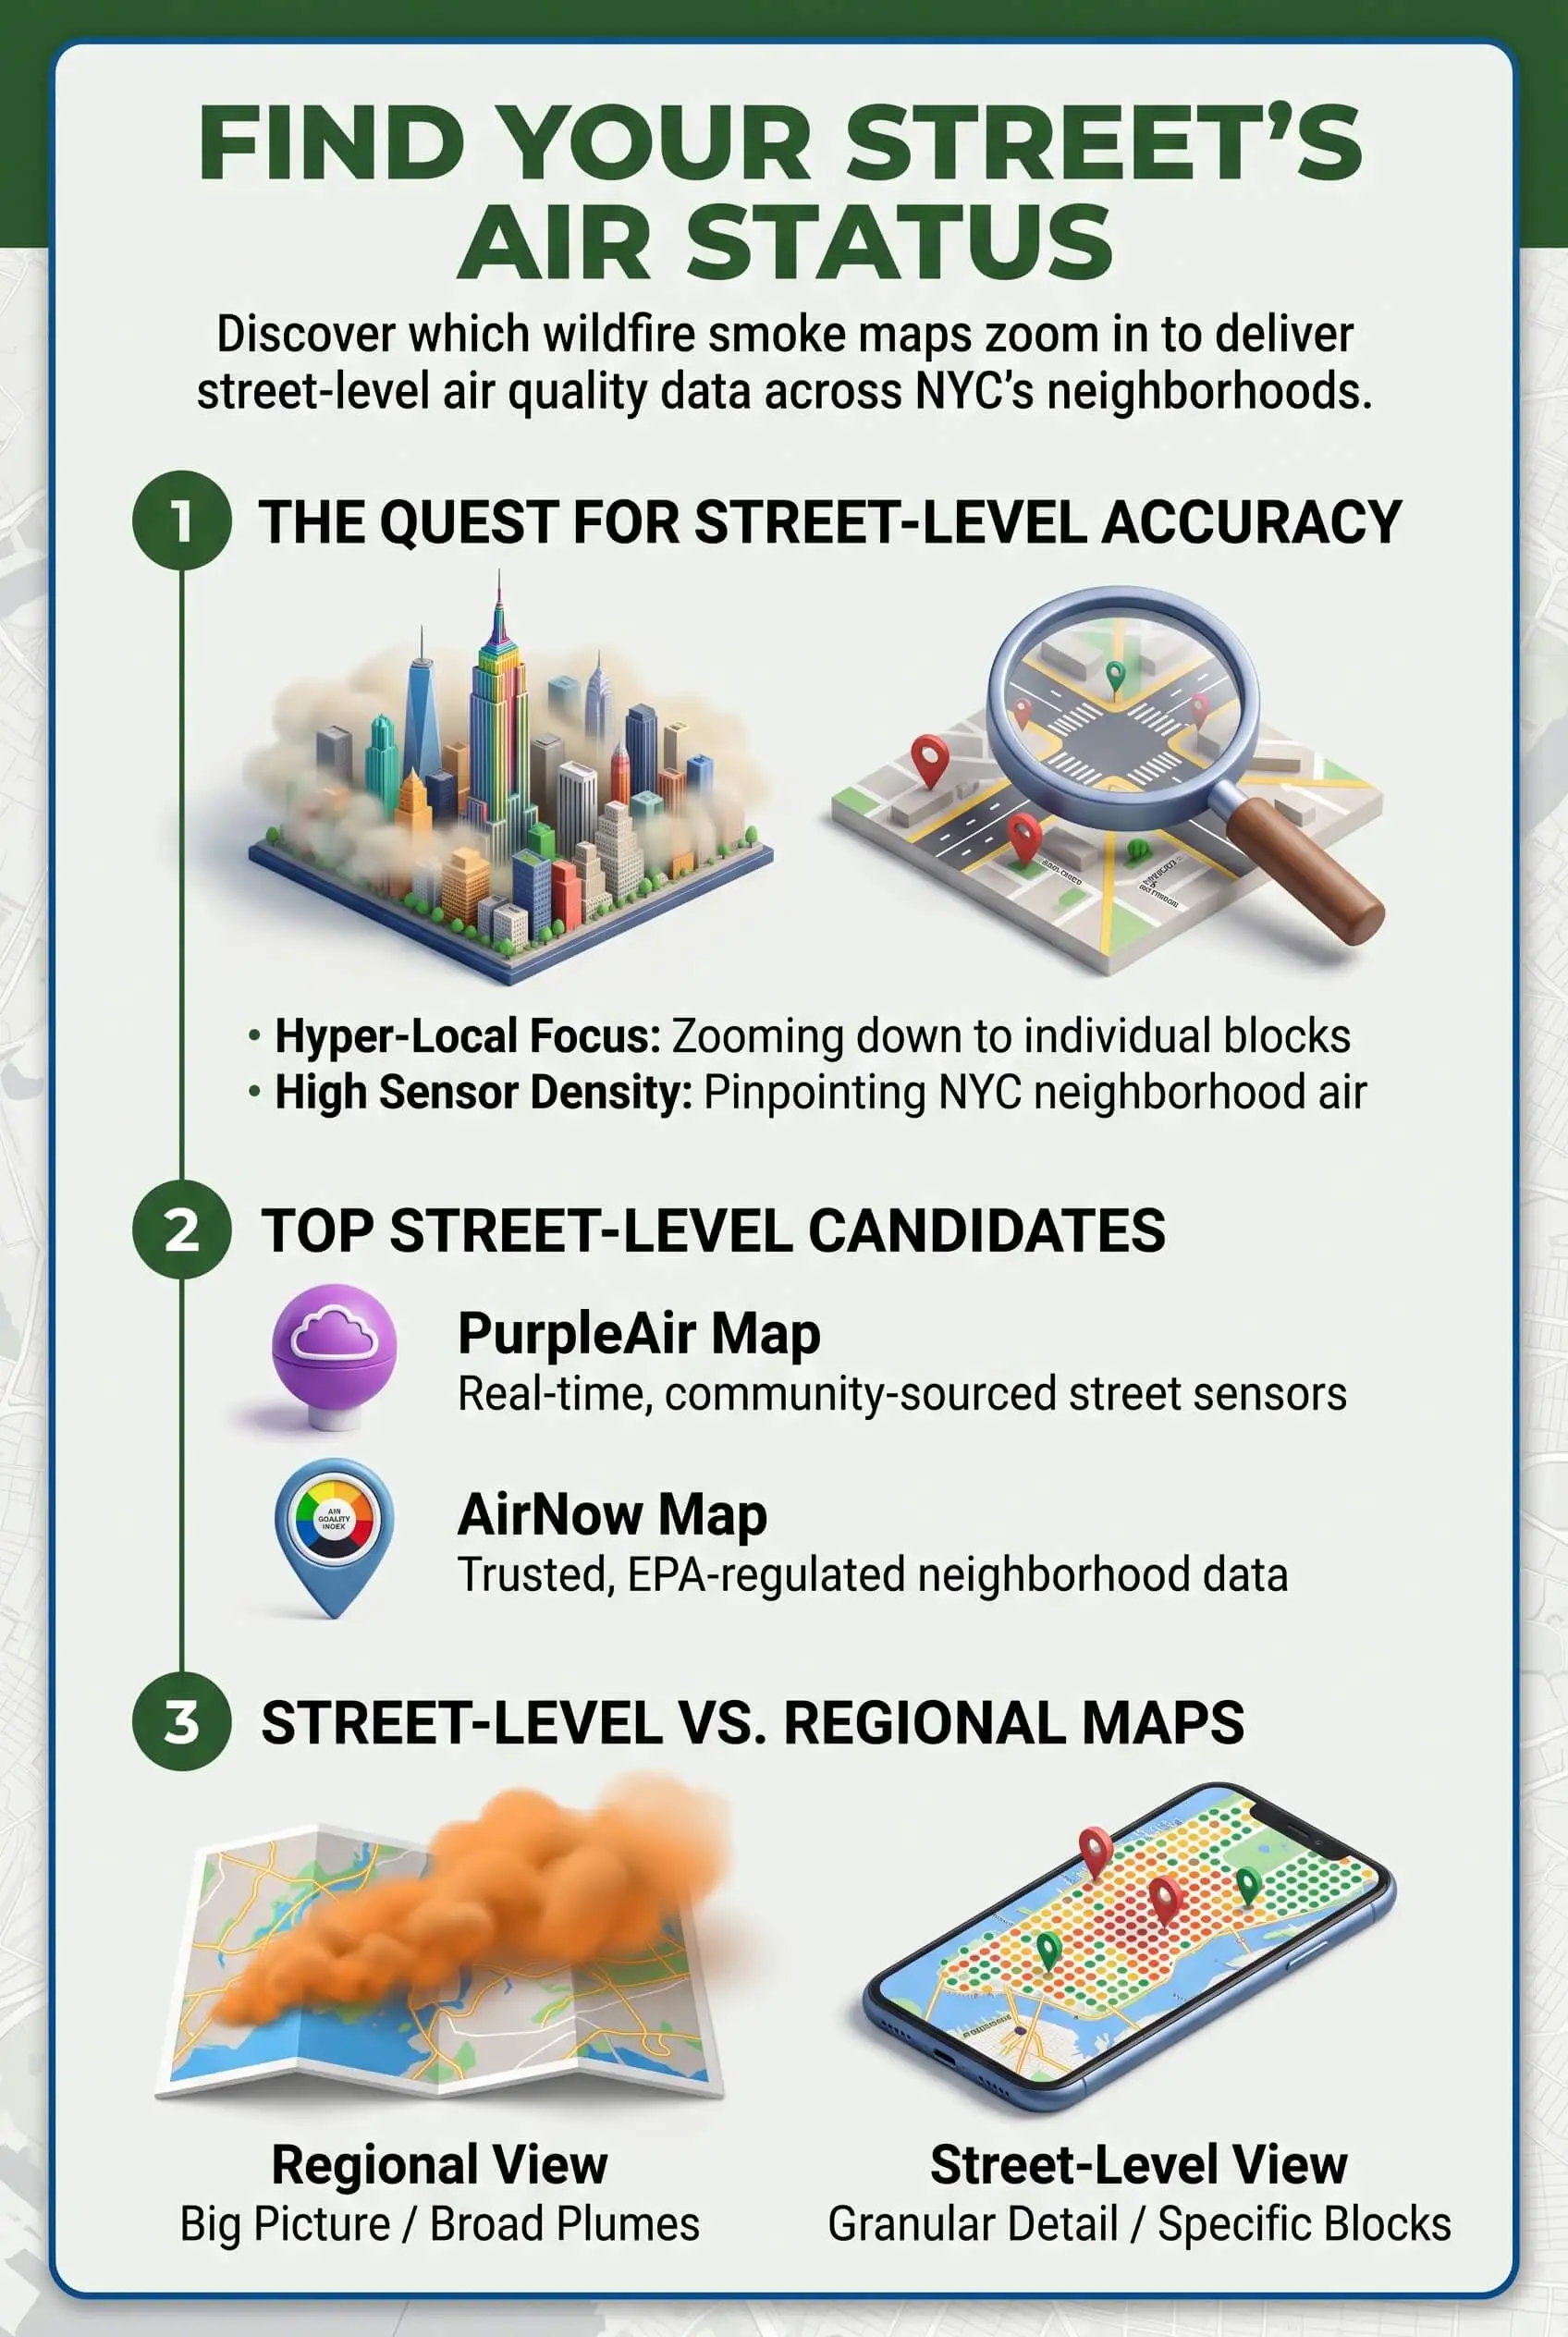
Smoke maps pull from four very different kinds of data. Only two get anywhere near street level.
Satellite smoke plumes. Analysts trace where smoke sits in the atmosphere, and a plume overhead can ride thousands of feet above the sidewalk.
Regulatory monitors. New York State runs the most accurate instruments in the city, but it mounts them on rooftops.
Corrected low-cost sensors. Hundreds of PurpleAir sensors fill in the blocks between official monitors.
Street-level monitors. NYC Health places samplers at street height, right where people walk and where traffic exhaust collects.
That's why two honest maps can disagree in the middle of the same smoke event. They measure at different heights and on different schedules, so their numbers drift apart.
Comparing the Smoke Maps New Yorkers Use Most
AirNow Fire and Smoke Map
Start with the AirNow Fire and Smoke Map. Circles mark permanent monitors, triangles mark temporary smoke monitors, and squares mark PurpleAir sensors that EPA corrects before it displays them. Because the sensors report 10-minute rolling averages, the squares react well before the circles do. Two catches. Plume outlines refresh only every few hours, and fire incident details can run days behind.
NYC Health Real-Time Air Quality
The city's real-time PM2.5 tracker is the only official source built for street level. It posts hourly readings from sites along the BQE, FDR Drive, and Van Wyck Expressway, right next to an average of the state's rooftop monitors. If you live near a highway, that side-by-side view shows whether smoke is stacking on top of the traffic pollution you already breathe.
PurpleAir Map
PurpleAir gives you the densest coverage in the five boroughs, often several sensors per neighborhood. Its raw readings run high, though. Before you compare a PurpleAir number to anything official, switch the map's conversion setting to "US EPA."
Live Borough Smoke and AQI Maps
Sometimes you want the whole picture on one screen. A live wildfire smoke map for New York City stacks active fire perimeters, satellite smoke plumes, and AQI color by borough, so one glance tells you where the smoke is coming from and how bad it is in your part of the city right now.
How to Read a Street-Level Reading Before You Trust It
A block-level number only helps if you know what it's telling you. Run these checks before you change your plans.
Confirm it's corrected. An uncorrected PurpleAir value can overstate fine particles by roughly 40 percent.
Look at the neighbors. When one sensor reads far below everything around it, someone may have mounted it indoors or labeled it wrong. Trust the cluster over the outlier.
Expect some lag. NowCast AQI blends recent hours, so official readings can trail what your nose already knows. Rising sensor squares give you the early warning.
Account for height. Rooftop and street numbers split furthest near busy roads.
Pro Tip: make health decisions with AirNow, and time your errands, runs, and window openings with the nearest corrected sensor.
What the July 2026 Smoke Event Showed
Last July put all of this to the test. Canadian smoke rolled in on top of a heat wave, and city officials ranked it the second-worst smoke event in New York's modern record, behind only June 2023. Readings swung hour to hour and borough to borough. Households watching sensor maps saw the spike coming. The ones watching only the daily forecast found out when the skyline disappeared.
What Street-Level Smoke Means for Your Ductwork
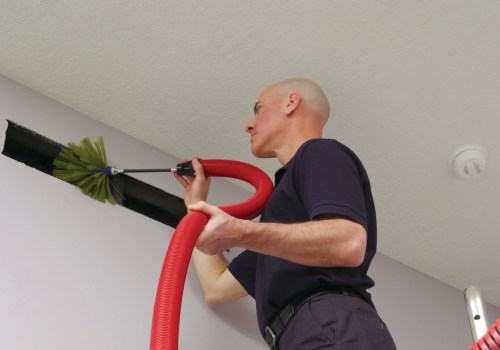
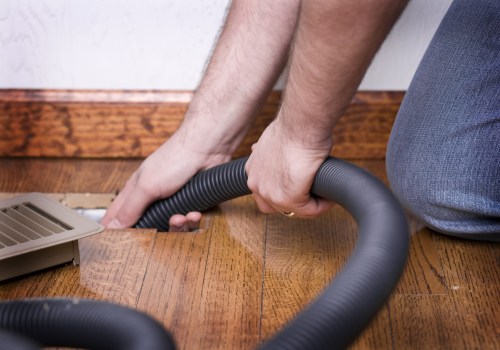
Smoke maps stop at your front door, but the smoke keeps going. Leaky return duct seams pull air from wall cavities, basements, and attics, while fresh-air intakes draw outdoor air straight in. Within hours, the haze on your block is circulating through your living room. Regular duct cleaning helps remove accumulated dust and debris from your HVAC system, supporting cleaner indoor air during wildfire smoke events.
You're the hero of your household here, and the fix takes very little effort.
Close the windows and set any fresh-air intake or vent to recirculate.
Switch the HVAC fan to On so air keeps moving through the filter.
Run a MERV 8 filter, or the highest rating your system can handle, to catch fine smoke particles.
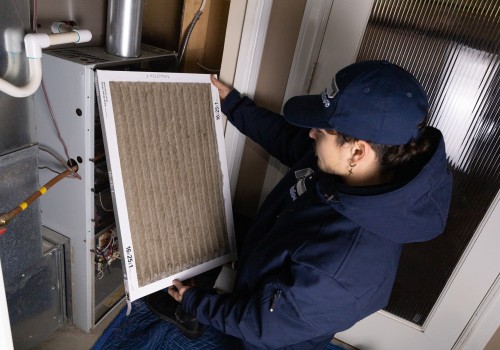
Swap in a fresh filter once the event passes, because a filter that worked through a smoke week is loaded and choking airflow.
Does one smoke event mean your ducts need cleaning? Usually not. Gray soot at the supply registers, or a smoke smell that hangs on after a new filter goes in, are the signs worth a professional inspection, especially in older homes where ductwork already carries years of buildup. This guide to the health effects of dirty ducts shows what else to look for.
"The filter tells the story of a smoke week better than any map. After the July event, I pulled filters from Queens and Staten Island homes that looked like they'd run six months, not six days. The homes that held up best already had a sealed return and a MERV 13 in place before the smoke showed up."
7 Essential Resources
Live Wildfire and Smoke Map for New York City. See fire perimeters, satellite smoke plumes, and borough-level AQI in one view, plus indoor protection steps matched to each AQI level. Source: linked in the map comparison section above.
NYC Community Air Survey. Learn why the city measures air at street height instead of rooftops, and how pollution shifts from one neighborhood to the next. Source: https://nyccas.cityofnewyork.us/nyccas2021v9/report/2
AirNow Fire and Smoke Map FAQ. Decode the map's circles, triangles, and squares, see how NowCast works, and find out how EPA corrects sensor data before showing it. Source: https://www.airnow.gov/sites/default/files/2021-07/Fire%20and%20Smoke%20Map%20FAQS%207.15.2021.pdf
EPA Air Sensor Research Overview. Read EPA's own account of how it tests low-cost sensors and new ways to measure wildfire smoke. Source: https://epa.gov/air-sensor-toolbox/epa-air-sensor-research-overview
NYS DEC Air Quality Index Forecast. Check regional AQI forecasts and Air Quality Health Advisories, which DEC issues when it expects levels to top 100. Source: https://dec.ny.gov/environmental-protection/air-quality/air-quality-index-forecast-current-observations
CDC: Wildfires and Your Safety. Find out who faces the most risk from smoke and how to protect children, pregnant people, and anyone with heart or lung conditions. Source: https://www.cdc.gov/wildfires/about/index.html
NOAA Hazard Mapping System. See how satellite analysts map fire locations and significant smoke plumes, and why NOAA treats that data as general guidance. Source: https://www.ssd.noaa.gov/PS/FIRE/about.html
3 Supporting Statistics
June 2023 smoke pushed New York City's AQI to a peak of 465, deep in the hazardous range. NYC Emergency Management warns that Canadian fires can carry smoke hundreds to thousands of kilometers. Source: https://www.nyc.gov/site/em/about/press-releases/20260715_pr-NYCEM-Smoke-From-Canadian-Wildfires-May-Affect-NYC-Air-Quality.page
Raw PurpleAir data overestimates fine particles by about 40 percent across most of the U.S. EPA researchers built a correction from nearly 12,000 paired measurements in 16 states, and it cut average error from 8 to 3 µg/m³. Source: https://amt.copernicus.org/articles/14/4617/2021/
The New York–Newark metro earned a D for short-term particle pollution in the 2026 State of the Air report, ranking 69th worst in the nation. Queens County logged the most unhealthy particle days in the metro. Source: https://www.lung.org/media/press-releases/fy26-sota-nyc
New York City's wildfire smoke events have pushed air quality into hazardous levels, while fine particle pollution remains a concern across the region. Checking live AQI readings and using top air filters with appropriate MERV ratings helps protect indoor air quality when wildfire smoke reaches the city.
Final Thoughts and Opinion
Chasing one perfect smoke map misses what kept people safe last July. The households that came through in the best shape didn't have a better app. They had a two-source habit, an official AQI for decisions and a nearby corrected sensor for timing.
My honest take is that the map only does half the job. A street-level reading tells you what's outside your window, and whether that smoke slips past your returns, your intakes, and your filter decides what your family breathes. Check the map. Then check the system standing between the street and your lungs. Using high quality filters helps capture fine smoke particles before they circulate through your home.
Frequently Asked Questions
Is there a live wildfire smoke map for NYC today?
Yes. The AirNow Fire and Smoke Map shows live fire locations, smoke plumes, and AQI from monitors and corrected sensors. Borough-level smoke maps pull those layers into one view, and NYC Health posts hourly street-level PM2.5 readings.
Which map shows air quality on my block?
Turn on the sensor layer in the AirNow Fire and Smoke Map and find the squares closest to you. If you live near a highway, compare them with NYC Health's street-level monitors.
Why does PurpleAir show a higher number than AirNow?
Uncorrected PurpleAir readings overstate fine particles by about 40 percent. Pick the "US EPA" conversion on the PurpleAir map, or use the AirNow map, which applies the correction for you.
Why is my neighborhood different from the citywide AQI?
The citywide number averages rooftop monitors. Street-level readings pick up traffic exhaust and local pockets of smoke, so they often run higher near busy roads.
Should I clean my ducts after wildfire smoke?
Usually not after a single event. Change the filter first. If gray soot shows up at the registers or a smoke smell lingers after the new filter goes in, book a professional inspection. Choosing a home air filter for allergies with a suitable MERV rating helps capture fine airborne particles during wildfire smoke events.
Know Your Block, Then Protect Your Home
A good smoke map shows you how bad the air is on your street, and your ducts and filter decide how much of it reaches your family. Bookmark a live map today and check your filter's MERV rating before the next smoke event rolls into the city. Choosing the best home air filter for allergies helps reduce airborne particles and keep your indoor air cleaner during wildfire smoke events.